Monitoring performance in Next.js
·8 min read
Why worry about performance?
Before we jump into how to measure performance, let me convince you that it's worth it.
Already convinced you should be measuring performance? Jump to the "Monitoring CWV in Next.js" implementation section below.
Each 100ms decrease in homepage load speed increases session conversion by 1.11%
At least, that was the case for Mobify. Quite a few sites saw dramatic increases in conversion by improving performance.
The team at Google came up with a list of reasons that performance matters and it can be broken up into the following categories:
1. Money
Let's say improving performance increases your conversion rate one percent. How big of an impact might that have on your profit?
Return on ad spend (ROAS) is a very important metric when doing any paid marketing. It's basically the measure of how efficient your ad spend is.
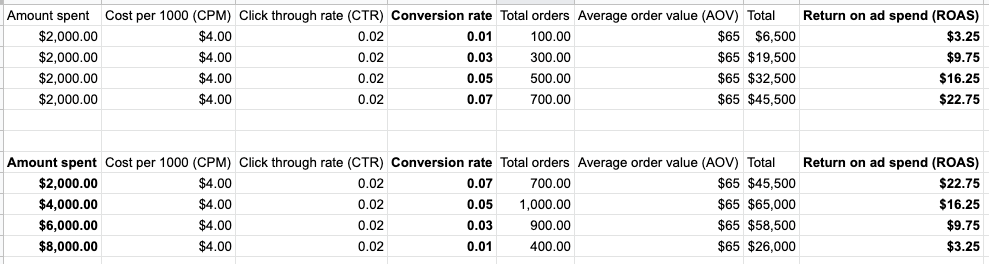
If you have a budget of $4000 and a conversion rate of 5%, you're dramatically outperforming your competition with double the budget if their conversion rate is 1%.
High conversion rates are the difference between success and failure, especially in low-margin businesses.
2. UX
Ever browsed a slow, jumpy, and bloated site? Did you have a good time? Exactly. Core Web Vitals encourage prioritizing visual and technical accessibility across teams. User experience is not solely the responsibility of the Design and UX team, it's something we all contribute to.
3. SEO
It's always been a bit of a secret how much Google thinks performance matters for search rank.
With the recent release of Core Web Vitals, I think they are making their stance more clear. Performance matters and will mater more and more over time.
Google has been signaling these metrics are very important.
Core Web Vitals are:
- Built into all Google tools
- Documented very thoroughly on web.dev
- Prominently displayed in Google Search Console
- Delayed launching Vitals due to COVID-19
To that last point, the delay: why would they need to delay the launch if it wasn't going to make a big impact? While much of this is speculation, I think the signals are showing that Google is going to skew rankings heavily based on Vitals.
4. Tech debt
I'm assuming this audience is pretty aware of what tech debt is.
While having good performance isn't a great indicator of no tech debt, bad performance usually means there's some form of bad tech debt hanging around.
Are you:
- Loading your images in a really weird way that none of your developers understand?
- Using a complicated architecture so measuring and thinking about performance is tricky for a single developer to think about?
- Relying on old tech and not updating to newer standards?
Building a culture that continuously improves performance will have the highest ROI over time.
Want to read more about tech debt? Read "On Good Tech Debt".
Monitoring Core Web Vitals in Next.js
If you aren't familiar with Core Web Vitals, they're a new set of metrics Google released to update their guidance on what a quality website performs like.
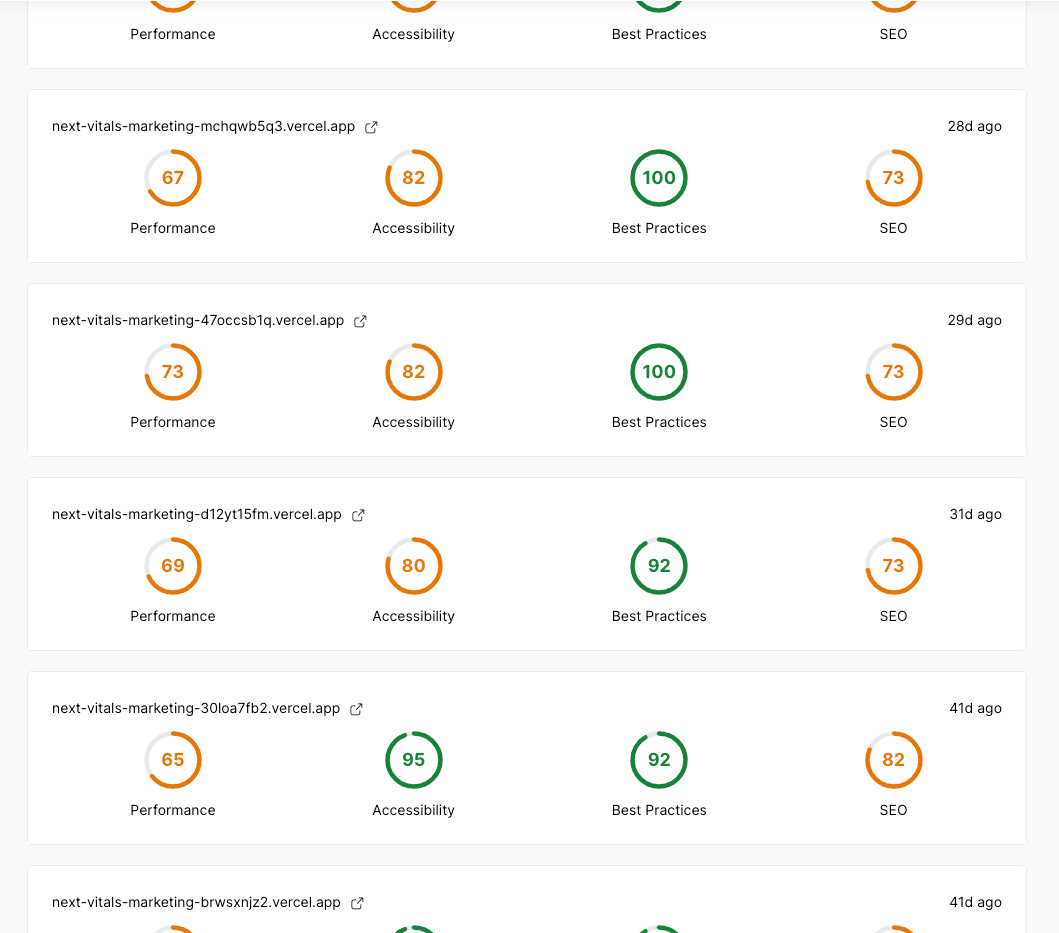
To get started monitoring your vitals, the easiest path is using FitVitals.dev, a tool I made to see what Google thinks of your performance.
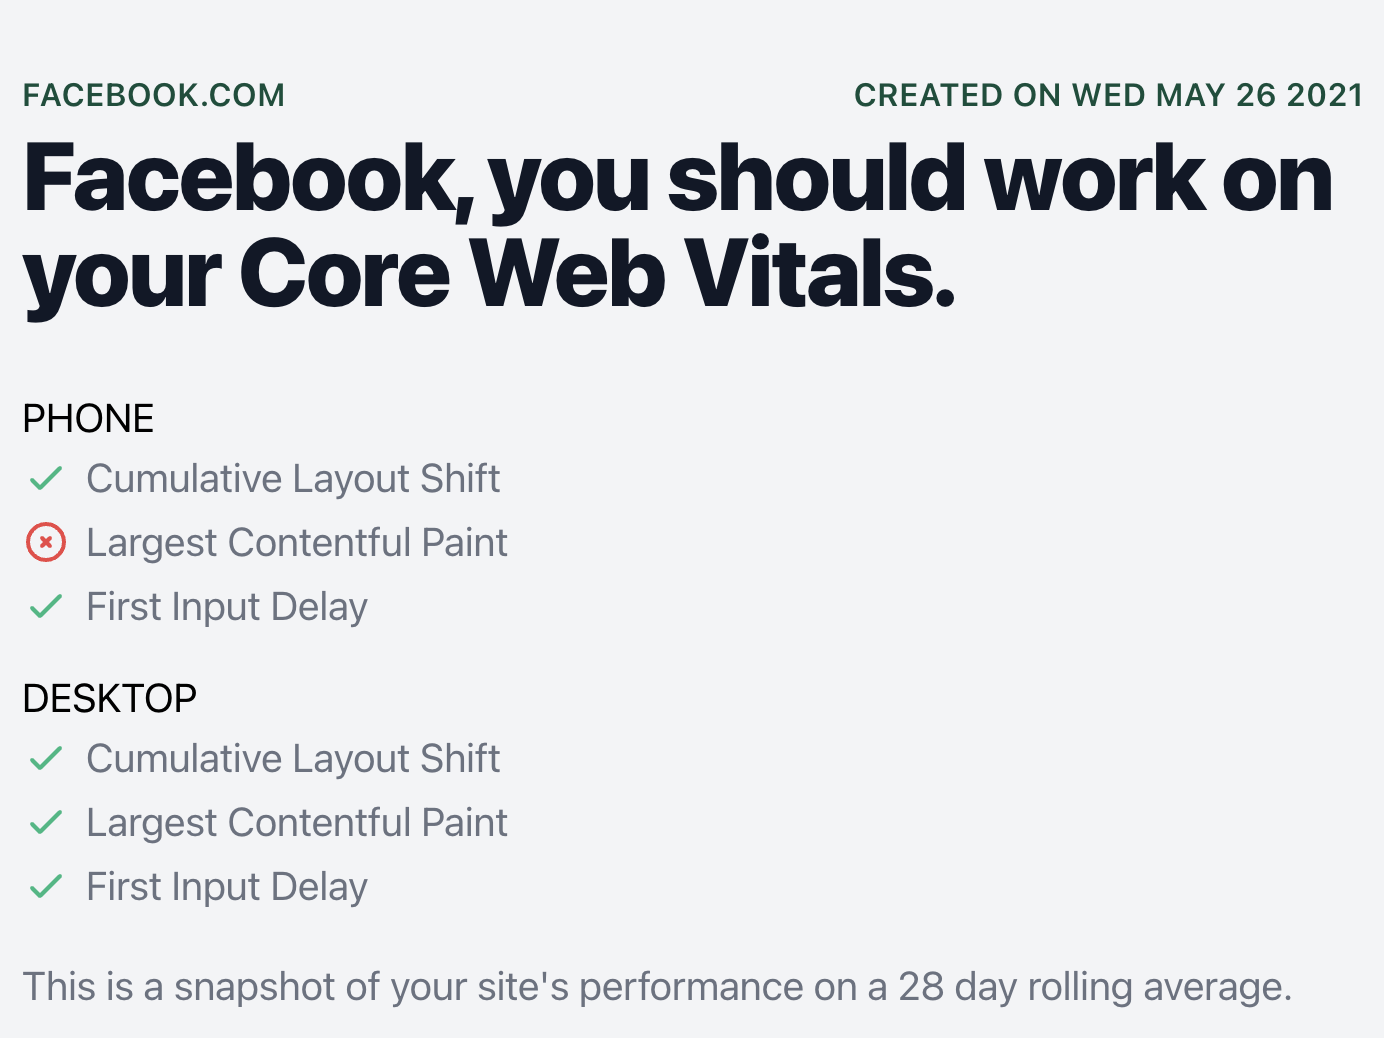
This tool only works if Google's CRuX API has enough data on your domain. Check it out and see your site's vitals.
In the lab
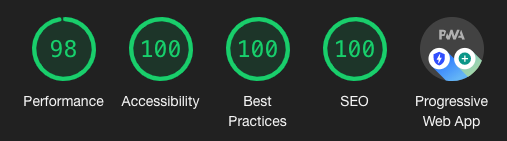
Front end performance monitoring and Lighthouse audits have been inseparable for quite some time. Lighthouse is an open-source tool for monitoring performance and finding areas of opportunity in your site. A screenshot of the green circles has become the goal of many engineering teams around the world.
These audits are a form of lab testing. Lab testing is exactly what it sounds like: testing in controlled conditions.
The approach a lot of teams are taking to solve performance woes is to run more audits.
Common options include:
- frequent local audits in Chrome
- paying for a SaaS monitoring tool
- as a step in the CI/CD process
These are all a step in the right direction. As I said earlier, the highest ROI fix is simply to change the engineering culture around performance.
I see lab testing as the low-hanging fruit for most engineering teams.
It gets developers thinking about:
- front end performance
- keeping payloads smaller
- back end request response times
While not perfect, consistent Lighthouse audits can get you 80% of the way to a performant site.
Setting up automated Lighthouse audits
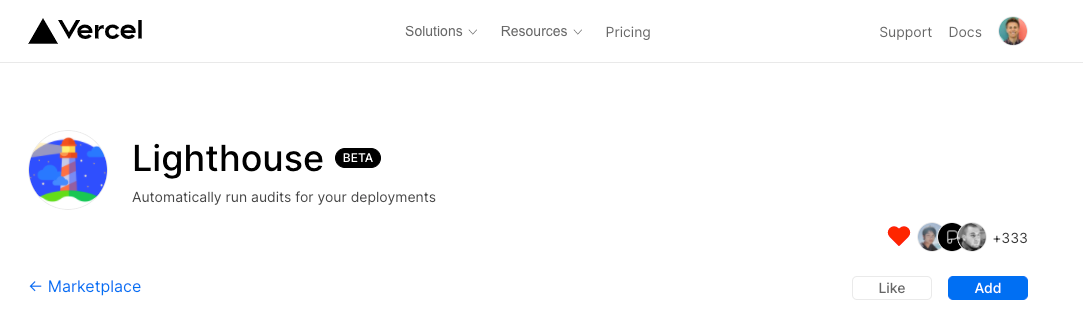
If you're hosting on Vercel, it's as simple as adding the Lighthouse integration to your site:
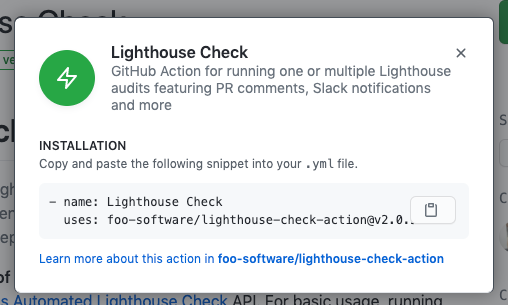
If you're not hosting in Vercel, you can use a step in your CI process (GitHub Actions).
This action provides many options for configuring:
- pull request comments
- Slack alerts
- failing a build on too low of scores
Simply add the action to the repo you'd like to test.
If you don't want to manage all this yourself, there are good paid SaaS solutions that get the job done. I'm currently using Calibre at my day job, and we've had success with that.
What's the catch?
Earlier I mentioned that Lighthouse audits aren't perfect. Why? Well, lab data isn't representative. The map is not the territory.
"It works on my machine" is the perfect example of why lab data isn't the best solution.
Consider a visitor of your site that lives in another country, far away from the AWS region you chose. Is their experience captured in your Lighthouse audit?
In the field
So say you're doing pretty well on your Lighthouse audits. How might you upgrade your performance monitoring game? Field data. Core Web Vitals will change the way we think about performance monitoring, specifically in the field.
Collecting performance data from real users is more representative than lab audits. Thankfully, Next supports collecting Core Web Vitals in the field directly in the framework.
The easy button option
If you're hosting your Next.js app on Vercel, the Vercel team recently shipped Next.js Analytics.
Because collecting Core Web Vitals is built into Next.js, you can start collecting them automatically when deployed to Vercel.
Vercel analytics is a paid product (though the Hobby tier has a trial version) and costs $10 per month + fees for additional events over a 10k threshold.
This is the best option for tracking Core Web Vitals if you're a business hosting on Vercel.
If you're looking for a more cost conscious option, consider sending your data to Google Analytics.
While Vercel has the best tool for tracking your vitals, I made a very simple free tool for checking your vitals at a glance: FitVitals.dev.
Setting up field tracking of Core Web Vitals in Next
Google Analytics is a very simple place to send Core Web Vitals.
You can use the added metrics to see how performance impacts:
- Conversion rate
- Bounce rate
- Time on site
and confirm the importance of performance for yourself.
You can even create custom alerts that will warn you each day/week/month if you've exceeded your performance budget.
Setup a Google Analytics property
Head to analytics.google.com and click the "admin" button in the bottom left.
- click "Create property" to get started
- Select "Web property"
- Add your production URL and set your timezone.
- After creating your property, it will give you a
Property Id.
Install analytics
To interact with Google Analytics in our Next.js app, I like to use analytics, an open-source library that supports tons of analytics providers.
Open source analytics library for browsers & node.js
We need to install it into our app as well as the Google Analytics plugin.
npm install analytics @analytics/google-analytics --save
Configure analytics
Now we need to configure analytics and import it into our app. First, create a file named analytics.js and configure it with your propertyId.
import Analytics from 'analytics'
import googleAnalyticsPlugin from '@analytics/google-analytics'
import Router from 'next/router'

// Initialize analytics and plugins
// Documentation: https://getanalytics.io
const analytics = Analytics({
  debug: process.env.NODE_ENV === 'production',
  plugins: [
    googleAnalyticsPlugin({
      trackingId: 'UA-73089861-6' // use your trackingId
    })
  ]
})

// Track initial pageview
if (typeof window !== 'undefined') {
  analytics.page()
}

// Track pageview on route change
Router.events.on('routeChangeComplete', (url) => {
  analytics.page()
})

export default analytics
GitHub source link. (P.s. - that snippet is borrowed from Divjoy, a React code generator that is totally worth buying in my opinion)
Configuring _app.js
In order to get this snippet to load on every page, we need to add it to our custom _app.js. We also need to add the Core Web Vital reporting function, reportWebVitals.
import '../styles/globals.css'
import analytics from '../util/analytics'

function MyApp({ Component, pageProps }) {
  return <Component {...pageProps} />
}

export function reportWebVitals({ id, name, label, value }) {
  analytics.track(name, {
    category: label === 'web-vital' ? 'Web Vitals' : 'Next.js custom metric',
    value: Math.round(name === 'CLS' ? value * 1000 : value), // values must be integers
    label: id, // id unique to current page load
    nonInteraction: true // avoids affecting bounce rate.
  })
}

export default MyApp
If you don't want to use the analytics library, the Next team great has documentation for that.
Success?
Time to test it out!
Deploy your code, or switch the debug value in analytics.js to
debug: process.env.NODE_ENV !== 'production',
Then, when you visit pages you should be firing events to Google Analytics.
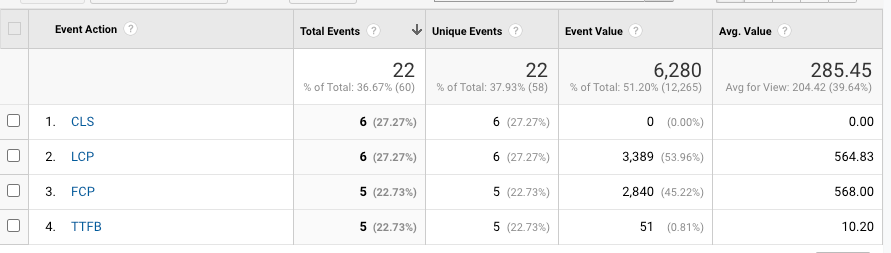
Hop over to Reports, Realtime, and Events to see if it's working.
To view historical data, go to Behavior, Events, Top Events and select Event Action as the primary.
Optional: set up alerts
If you want to set up daily email alerts for your Vitals in Google Analytics, head to Admin, Custom Alerts.
Set it up like so:
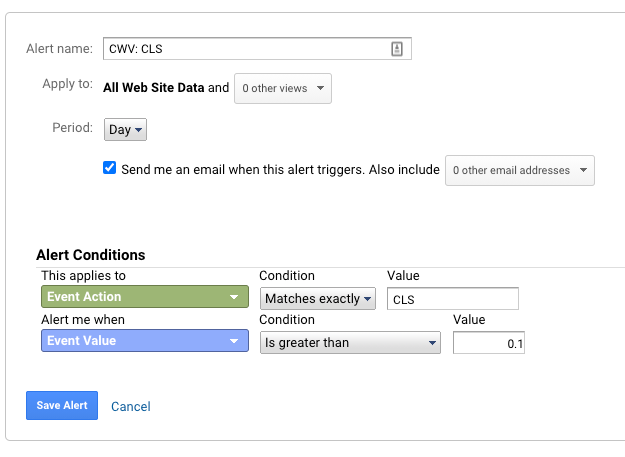
Now I'll get alerted anytime my CLS goes above 0.1 on a daily basis.
Conclusion
While I'd recommend the field performance monitoring approach, my ultimate recommendation is to simply start.
Don’t let the perfect be the enemy of the good
Both options provide ample information to start improving your performance today.
Learn more
If you're interested in Core Web Vitals, performance monitoring, or everything Next.js, check out my newsletter.
I also tweet @dbredvick on Twitter. Feel free to DM me or email me at drewb@hey.com.
Stay up to date
Get essays and field notes delivered as soon as they publish.